

Core Views:
- US: US curve steepening bias while remaining tactical on duration
- Europe: Looking to enter steepening trades, remain tactical in Italy & peripherals at current levels
- UK: Post-Brexit environment favours yield curve steepening positioning. Long UK vs. Germany.
- FX: Opened longs in JPY & RUB tactically while shorting AUD, KRW & ZAR.
- Credit: Maintain a low spread duration via single names, stay tactical in primary markets and on issuer curves, short credit beta
There are a number of points in the last 10 years when one could have predicted that valuations on areas of the credit market might fall back to earth. We’re not bold predictors of the future ourselves, whether that might be utopian or apocalyptic, so why make this statement now and place our heads above the parapet?
First of all, if you believe that core credit markets will always pay investors a premium over their government counterparts (so spreads will never be negative), then the reward on offer for the spread risk being taken right now is near all-time lows (Chart One). In that sense, buyers of credit beta at current levels are expressing short-volatility bets, something we do not consider wise at current levels.
But to arrive at a decision to materially alter our positioning, we continue to dig for more evidence than just the obvious case of stretched spread valuations – so let’s get back to basics as we explore the case for a possible about-turn in credit spread direction.
The Current Landscape
Credit returns comprise two components: price, determined by spread movements; duration and ‘roll down,’ which is driven by curve steepness; and income, the yield of the credit instrument. Most investors will form a view on at least one of these two contributors to total returns before investing (long or short).
Given that corporate bond price upside is limited, we understand why investors are intensely focused on the carry component in current circumstances. This asymmetric return profile of bonds famously manifests itself in the oft-perceived gloomy ‘glass half-empty’ mindset of bond investors when compared to their more optimistic equity counterparts.
With respect to future spread performance, since the financial crisis, central banks have distorted the ability of credit spreads to reflect fundamentals, instead anchoring spreads at lower levels by various means, including corporate bond buying programs. The repercussions have been numerous and include large scale, opportunistic issuance on top of incessant bidding in both primary and secondary markets by investors who know full well that central bank puts are at the ready to stem any deep corrections, particularly in Europe. But the past is the past, and lower spreads and yields point to less insulation against threats when considering forward looking returns.
Assessing the Threats
When selecting focal points for risk in credit, we use a number of methods to assess the performance potential of spreads across different segments of the universe, both negative and positive. With spreads not far from post-crisis tights, much of what we uncover from our alternative valuation models tells us little that we don’t know from just looking at long term spread charts; i.e., spreads are tight and the upside is limited. However, in the context of the increasing popularity of carry trades and themes, we have been spending time considering how to reliably assess the potential returns for 2020 specifically, and certain red flags have appeared, largely due to the extreme sensitivity of total returns to spread movements, when compared to historical periods.
Let’s take the extreme example of Europe. European investment grade spreads finished 2019 at 94 basis points, only 10 basis points or so away from the post crisis tights. Using year-end duration, that equates to a price upside (ignoring roll down) of around 0.6% at current universe duration, if you believe that spreads might re-touch those post crisis tights. This 0.6% return appears meagre, yet many point out the appeal of such a return when compared to the alternative of holding a negative-yielding German government bond.
But let’s step out of the bubble and get some perspective – taking the spread of 94 basis points and the year-end duration of 5.2, only a ~17-basis point widening will ‘wipe out’ the entire excess carry benefits of holding European investment grade credit over German governments. At 17bps this ‘spread wipe out’ metric is approaching the post crisis low of 14-basis points, only twice previously seen, in January 2018 and February 2015. In both instances these tights preceded the two most aggressive moves wider in spreads witnessed since the GFC, accompanied by negative returns for the subsequent 12 months, all in spite of active central bank corporate buying during those same periods.
The ‘Wipe-Out’ Metric
NB: The Wipe-Out Metric outlined below broadly describes today’s credit spread sensitivity for one market in a historical context. We have additional chart packs and notes that we can make available to those who are interested in a presentation of other markets. To request this, simply email info@rescoam.com for more information.
We were interested in what additional intelligence we could derive from thinking in terms of a ‘wipe out’ metric and how it could influence our quantitative expectations for spreads and returns in 2020. When studying the European investment grade wipe out data set, we see that the average return for the wipe out occurrences that fell in the 4th quartile of the metric’s levels over the past 10 years (which is where the current level sits) is a meagre 0.5%, well behind the 3rd and 2nd quartiles, (4.3% and 4.6% respectively) and some way behind the 1st quartile which averages a 7% return. For this series, the 4th quartile also contains 8 of the 11 negative subsequent 12 month returns.
In taking a birds eye view of the asset class and considering these broad segments, we find that the current ‘wipe out’ level is precariously low, at or inside the 2015 and 2018 lows, with US high yield offering a glimmer of brightness, but only in relative terms, as it still sits in the 3rd quartile. European high yield sits in a space where ~69 bps of widening would wipe out a year’s spread over equivalent governments. US investment grade spreads are testing the 10-year tights below 100 bps, with yields also not far from the 2.5%-decade lows reached in 2013. The ‘wipe out’ factor sits at 12 bps, equal to the previous low of January 2018, and inside the Q3 2017 prior bottom of 14 bps. This is the second-lowest reading from the sample by just a few tenths of a basis point. For this set, the average return for the 4th quartile is 2%, although the average for the lowest decile is -0.6%.
US high yield sits on a slightly more optimistic footing, with the current wipe-out level at 110 bps, ~30bps from the 2018 and 2017 lows. When looking at the 12-month total returns against spread and yield levels, we saw that that spreads under 400 bps mainly coincide with limited performance in the subsequent 12 months. Of the 40 instances in which spreads were under 400 bps, the average return was ~3.3%.
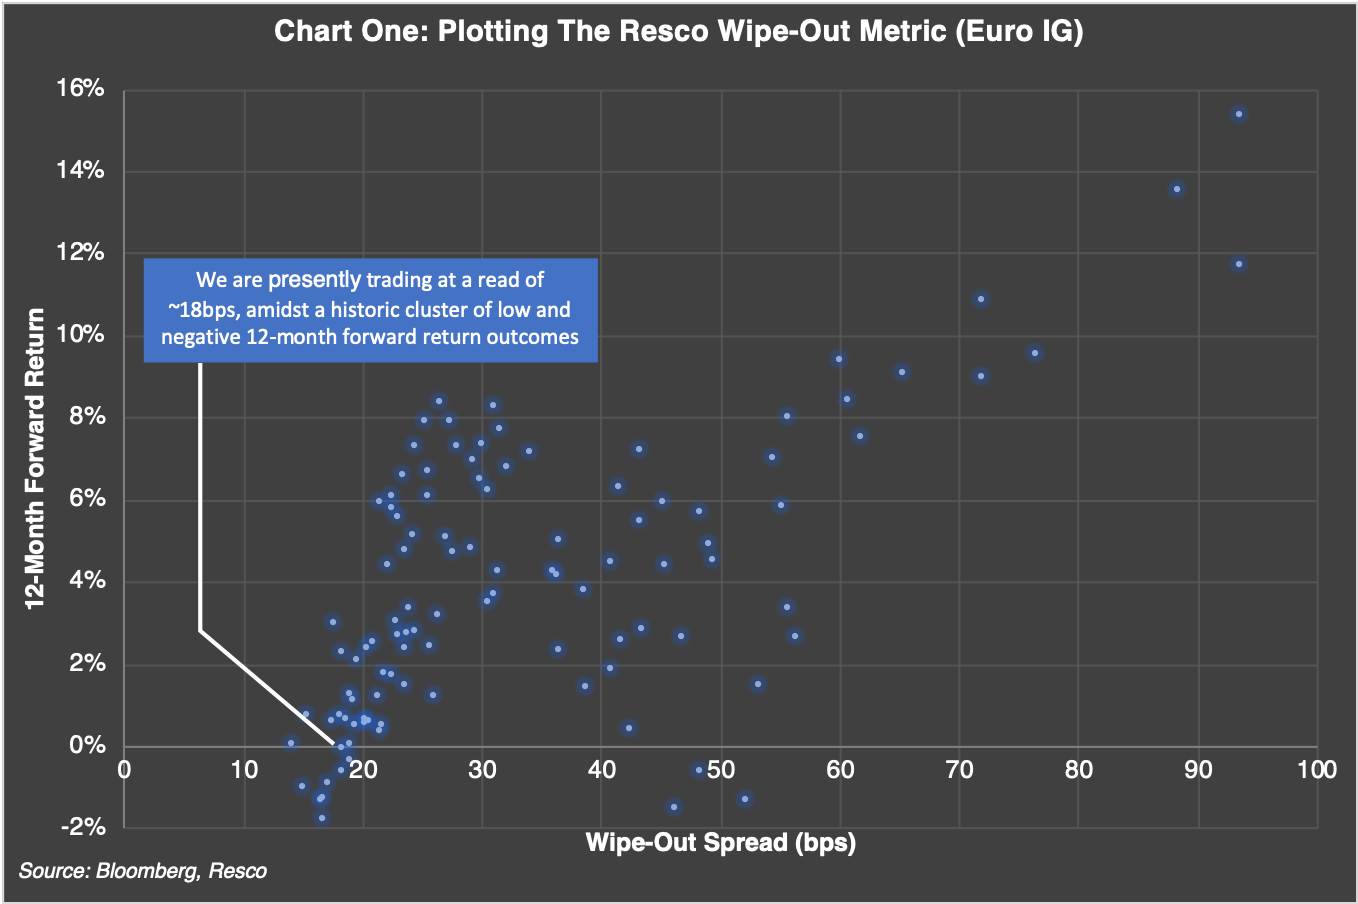
European investment grade is precariously placed, with the mix of high duration and low spreads/yields leaving the wipe out metric near all time lows. The chart above plots the historical 12-month returns (vertical axis) versus the duration-adjusted spread (horizontal axis) since 2010.
Conclusion
This alternative way of stress testing the return outlook is just one of many we consider when informing our strategic and tactical macro allocations to credit over short and long-time horizons. Based on the above, it will not come as a surprise that we hold a dim view on credit beta, with carry offering only limited protection against spread movements – we see a strong case for a short bias in early 2020.
More generically, a short bias set-up chimes with our qualitative assessment that the case for spread widening can materialise in both a risk-off and an extension of the risk-on phase. The latter can be explained by a perceived diminishing relative attractiveness of credit, should the consensus-held view of reflation materialise, and our expectation of further rate curve steepness materialises, which in turn would see the safest assets—such as the US 10-year Treasuries—offering yields above 2%, for example.
We see growing complacency around expectations for fixed income in 2020. We ourselves expect geopolitical risks to be faded, US elections to play out in a market-friendly manner and central banks to remain supportive. This has been a healthy environment for risky asset returns in the past.
However, with the asymmetry of returns (in both absolute and relative terms) very dire and both return components of price and spreads offering little solace, we see the persistence of euphoria in credit markets as a window of opportunity to take profits on long positions before building a negative expression on credit beta across Europe and the US.
-
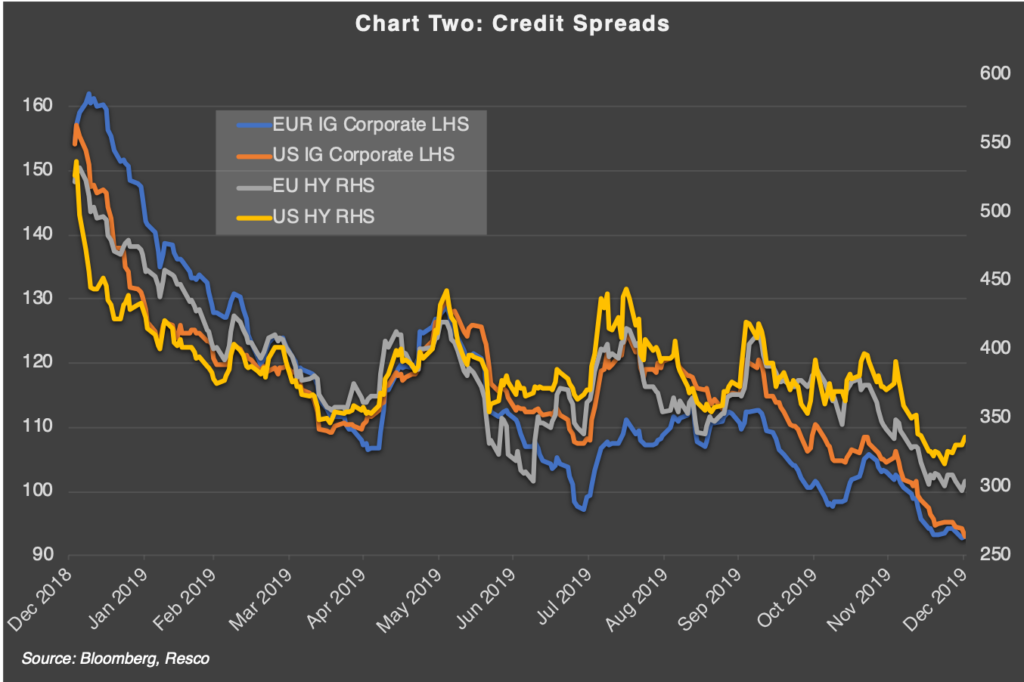
- Credit spreads continue their march lower into year end, showing remarkable resilience to new supply pressures

-

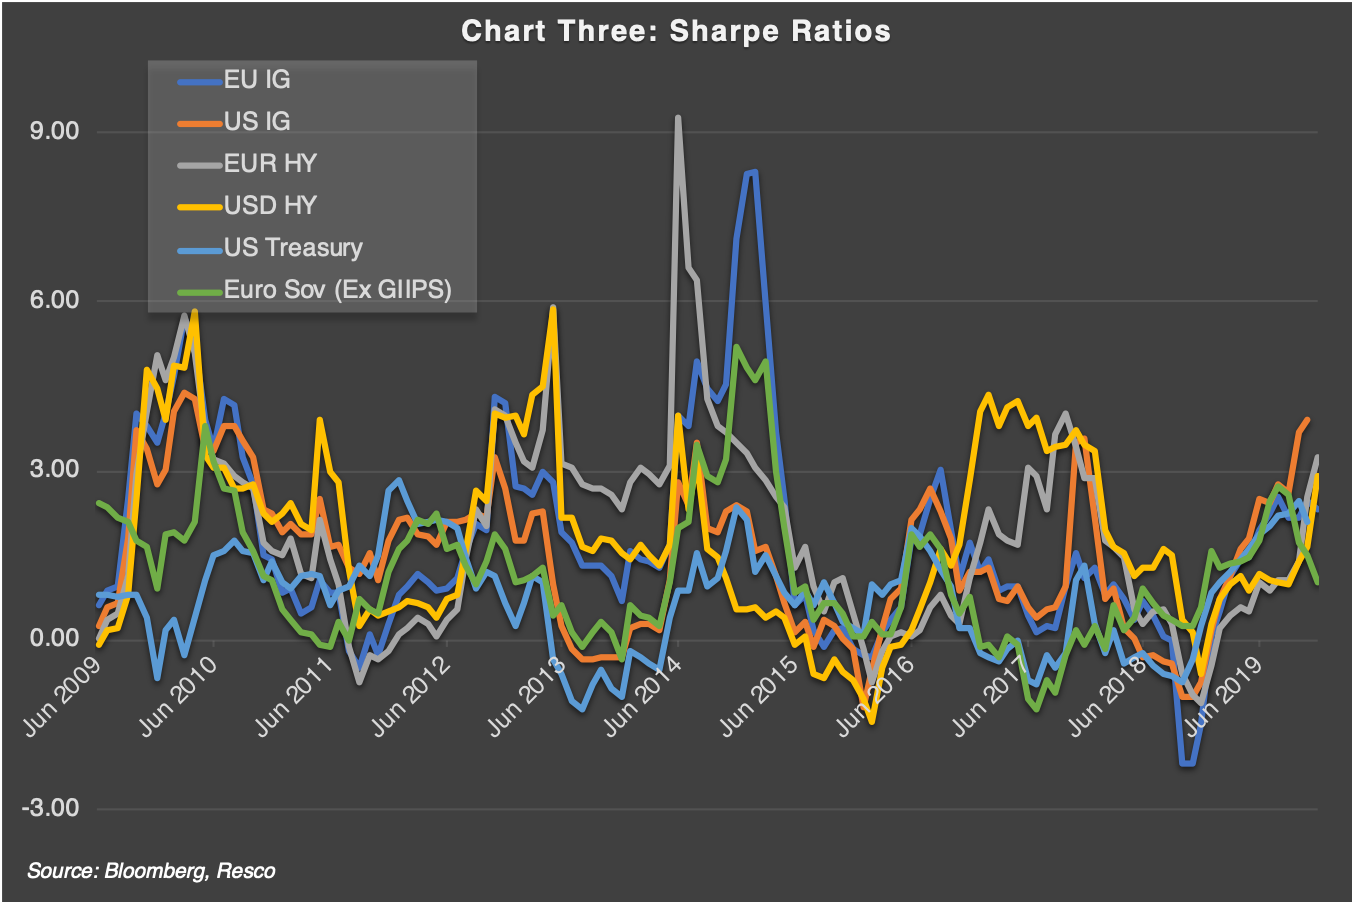
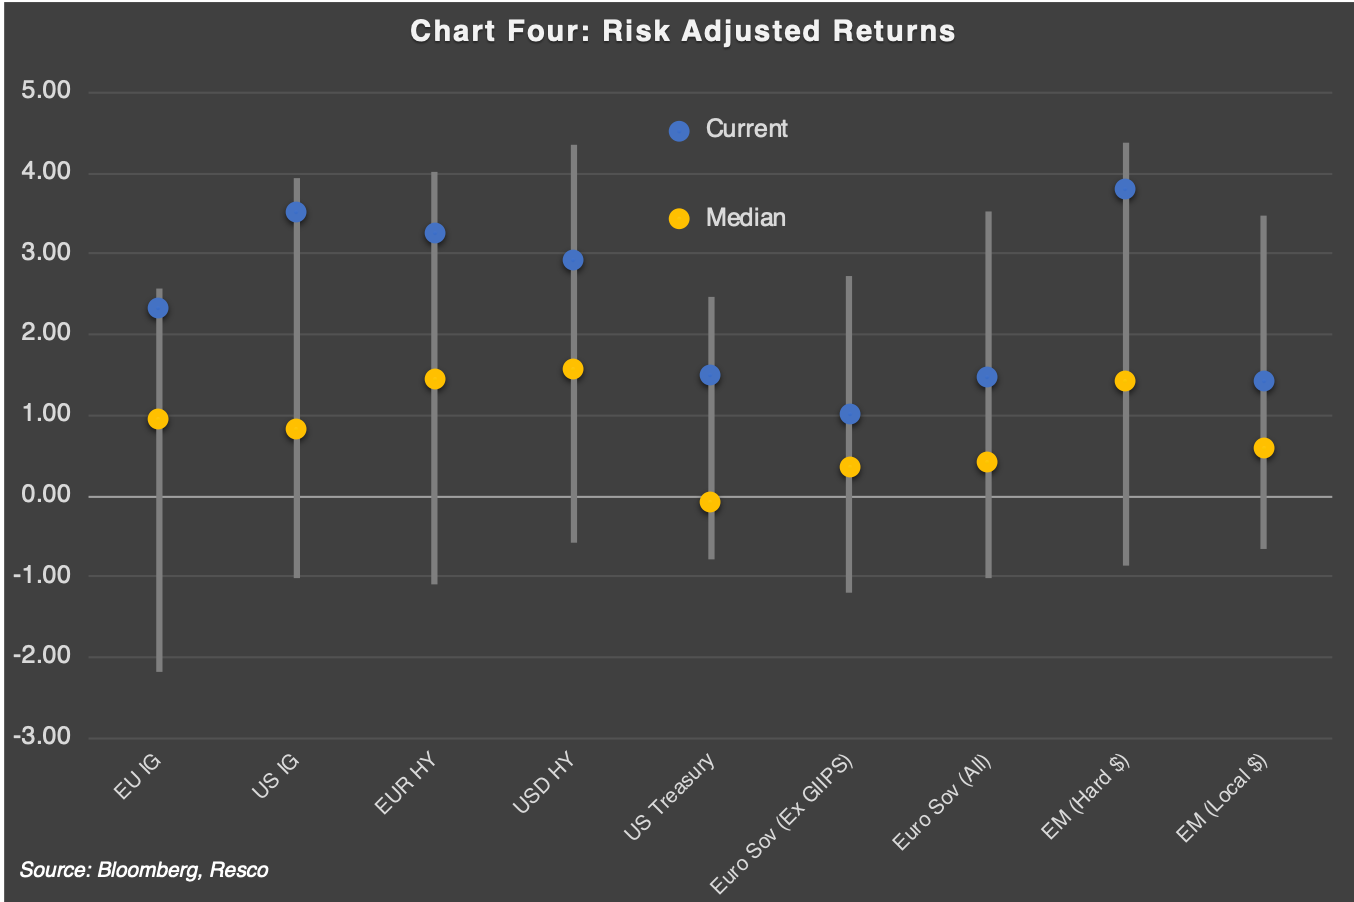
- Since the financial crisis, traditional asset classes have offered untraditional risk return profiles (sharpes), and 2019 has been no different
-
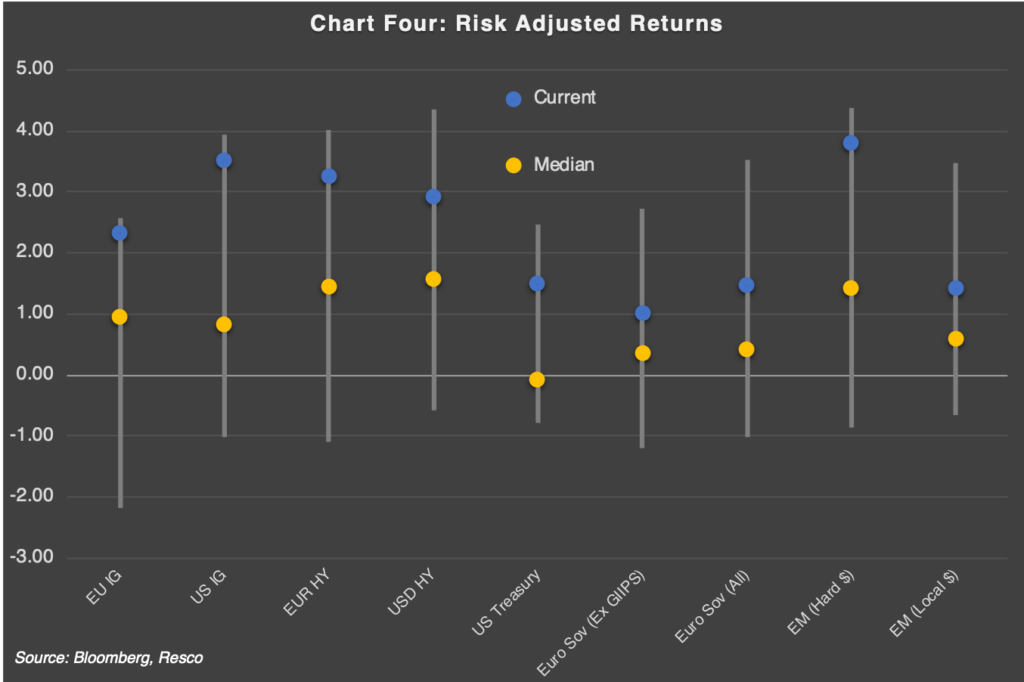
- Risk Adjusted Returns (Sharpe Ratios, 12m Rolling, 3yr Range)
Summary:
- US data stabilising and pointing to acceleration, while inflation readings are rebounding
- Global growth has stabilised following aggressive global central bank easing and overall liquidity injection in the US and Europe
- Government rates offer protection only from a recession scenario and/or aggressive cuts into a new negative rate paradigm
- Credit spreads still driven by external, rather than fundamental, factors, while fund flows are important for spreads and remain stable – scaling into the first stages of a short beta position
Thank you for reading and don’t forget to comment, share and contact us for questions – the Resco Team
A Word on Resco: Resco Asset Management Limited is a 30+ year project that aims to join other like-minded firms in lifting the perception of the investment management industry, while maintaining a laser-sharp focus on net returns by charging sensible fees and limiting fund expenses. Keen for their friends and family to see the virtues in solving investors’ problems and to be looked upon just as favourably as any other corporate innovator, its three co-founders focus on aspects and values that can drive healthier relationships between them and their community of investors and observers.
Resco’s first product, the Resco Macro Credit Fund, is a global absolute return unconstrained fixed income product that aims to capture performance from global macro themes and corporate bonds to deliver positive total returns to investors throughout market cycles, leveraging its portfolio managers’ existing 10-year+ track records.
The three co-founders own 100% of the business and mandate a majority future executive ownership, thus remain focused on the long-term goal of building a trusted reputation upon a culture of investment excellence, without applying conventional short-term incentive structures that can tempt individuals to overrepresent their particular field of expertise during various cycles. This promotes a meritocracy while allowing senior managers to assume accountability, by focusing on process before individuals.
Its vision to ‘Create a more prosperous world’ signals Resco’s commitment to contribute to a rising tide of prosperity at all levels, through investment management, corporate transparency, community involvement and philanthropy. Resco is a signatory to the UN Principles for Responsible Investment.
All content included in this presentation is for information purposes only and neither constitutes investment advice nor an offer to to issue, solicit or sell any investment.
Resco makes no undertaking, warranty, guarantee or representations as to the reliability, accuracy or completeness of any information contained in this document, which contains opinions of the manager. This document is confidential and must not be distributed or disclosed to those other than to whom it is addressed without the explicit prior written consent of Resco Asset Management Limited.
Resco Asset Management Limited, 71 Central Street, London EC1V 8AB. Resco is a registered trademark of Resco Asset Management Limited. Resco Asset Management Limited (814308) is authorised and regulated by the Financial Conduct Authority.


